| 姓名 | 行业 | 分享, % | P/BV | P/S | P/E | EV/Ebitda | 股息率 |
|---|---|---|---|---|---|---|---|
 SAP SAP |
Technology | 5.20846 | 3.77 | 5.24 | 26.66 | 20.65 | 1.31 |
 Toyota Motor Corporation Toyota Motor Corporation |
Consumer Cyclical | 4.86453 | 1.47 | 1.15 | 10.47 | 9.78 | 3.73 |
 Hitachi, Ltd. Hitachi, Ltd. |
Industrials | 3.04708 | 2.19 | 1.32 | 21.8 | 9.89 | 1.68 |
| Mitsubishi Corporation | Industrials | 2.3348 | 1.52 | 0.7863 | 15.96 | 9.21 | 3.51 |
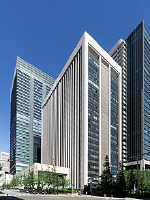 Mitsubishi UFJ Financial Group, Inc. Mitsubishi UFJ Financial Group, Inc. |
Financials | 2.19244 | 0.9111 | 3.62 | 12.68 | -27.04 | 4.14 |
| RELX | Consumer Discretionary | 1.96194 | 0 | 0 | 0 | 0 | 0 |
| Richtech Robotics Inc. | Industrials | 1.93706 | 1.82 | 17.87 | 0 | -8.85 | 0 |
 Tokyo Electron Limited Tokyo Electron Limited |
Technology | 1.84774 | 10.25 | 9.85 | 49.56 | 34.56 | 0 |
 ITOCHU Corporation ITOCHU Corporation |
Industrials | 1.81429 | 1.58 | 0.676 | 11.83 | 10.29 | 2.36 |
 Shin-Etsu Chemical Co., Ltd. Shin-Etsu Chemical Co., Ltd. |
Materials | 1.65199 | 3.06 | 5.61 | 26.05 | 11.59 | 4.2 |
| Capital Senior Living Corporation | Healthcare | 1.64747 | 29.11 | 0.24 | 0 | -14.31 | 0 |
 Tokio Marine Holdings, Inc. Tokio Marine Holdings, Inc. |
Financials | 1.34153 | 1.79 | 1.26 | 13.32 | 8.11 | 3.75 |
| Sumitomo Mitsui Financial Group, Inc. | Financials | 1.3347 | 0.804 | 2.68 | 12.36 | -16.32 | 12.21 |
| Mitsui & Co., Ltd. | Industrials | 1.30488 | 1.38 | 0.8063 | 10.1 | 11.44 | 3.82 |
 Nintendo Co., Ltd. Nintendo Co., Ltd. |
Communication Services | 1.30253 | 3.71 | 5.78 | 19.69 | 11.7 | 3.63 |
 Fast Retailing Co., Ltd. Fast Retailing Co., Ltd. |
Consumer Cyclical | 1.24656 | 6.89 | 4.59 | 38.29 | 17.63 | 1.29 |
 Mitsubishi Heavy Industries, Ltd. Mitsubishi Heavy Industries, Ltd. |
Industrials | 1.19764 | 1.94 | 0.981 | 20.58 | 10.95 | 1.66 |
 Spotify Technology S.A. Spotify Technology S.A. |
Telecom | 1.18912 | 16.29 | 5.74 | 79.11 | 58.24 | 0 |
 SoftBank Corp. SoftBank Corp. |
Communication Services | 1.17317 | 2.45 | 1.59 | 19.74 | 8.68 | 6.78 |
 Honda Motor Co., Ltd. Honda Motor Co., Ltd. |
Consumer Cyclical | 1.14232 | 0.7081 | 0.4508 | 8.32 | 5.47 | 5.69 |
 Information Services Group, Inc. Information Services Group, Inc. |
Technology | 1.12879 | 2.33 | 0.8189 | 38.73 | 12.84 | 5.32 |
 Ferrari NV Ferrari NV |
Consumer Discretionary | 1.098 | 17.96 | 9.24 | 44.06 | 24.42 | 0.6168 |
| Japan Tobacco Inc. | Consumer Staples | 1.03226 | 1.75 | 2.3 | 15.64 | 9.48 | 6.9 |
 Boeing Boeing |
Industrials | 1.00073 | -9.16 | 2.03 | 0 | -255.84 | 0 |
 Banco Bilbao Vizcaya Argentaria, S.A. Banco Bilbao Vizcaya Argentaria, S.A. |
Financials | 0.94879 | 0.0691 | 1.65 | 6.09 | 1.3 | 6.55 |
 Advantest Corporation Advantest Corporation |
Technology | 0.90932 | 11.55 | 10.24 | 79.98 | 42.57 | 0.7857 |
 NEC Corporation NEC Corporation |
Technology | 0.84404 | 1.41 | 0.8447 | 19.64 | 8.01 | 1.49 |
 Mizuho Financial Group, Inc. Mizuho Financial Group, Inc. |
Financials | 0.75369 | 0.7482 | 2.47 | 11.36 | -39.19 | 5.34 |
 Disco Corporation Disco Corporation |
Technology | 0.74108 | 14.55 | 19.24 | 70.26 | 43.03 | 0.9915 |
| Brookfield Corporation | Financials | 0.72518 | 0.38 | 0.6098 | 56.29 | 10.18 | 0.6712 |
 Chugai Pharmaceutical Co., Ltd. Chugai Pharmaceutical Co., Ltd. |
Healthcare | 0.70773 | 5.41 | 7.92 | 27.04 | 18.68 | 2.06 |
 Canon Inc. Canon Inc. |
Technology | 0.70504 | 1.02 | 0.8833 | 13.96 | 6.2 | 4.57 |
 Mitsubishi Electric Corporation Mitsubishi Electric Corporation |
Industrials | 0.68881 | 1.38 | 1.02 | 18.75 | 8.6 | 3.02 |
 MS&AD Insurance Group Holdings, Inc. MS&AD Insurance Group Holdings, Inc. |
Financials | 0.6793 | 0.922 | 0.6344 | 11.27 | 3.31 | 4.42 |
 Stellantis N.V. Stellantis N.V. |
Industrials | 0.67381 | 0.8082 | 0.3502 | 3.57 | 1.71 | 10.34 |
 Alimentation Couche-Tard Inc. Alimentation Couche-Tard Inc. |
Consumer Cyclical | 0.65496 | 4.06 | 0.7804 | 19.8 | 11.73 | 1.21 |
 FUJIFILM Holdings Corporation FUJIFILM Holdings Corporation |
Industrials | 0.59828 | 1.3 | 1.4 | 16.97 | 10.69 | 2.1 |
| Otsuka Holdings Co., Ltd. | Healthcare | 0.59215 | 1.21 | 1.46 | 24.22 | 6.78 | 2.28 |
 Marubeni Corporation Marubeni Corporation |
Industrials | 0.57859 | 1.26 | 0.6193 | 9.52 | 14.67 | 5.19 |
 Sumitomo Corporation Sumitomo Corporation |
Industrials | 0.57292 | 0.968 | 0.6545 | 11.71 | 11.56 | 5.43 |
 Mitsui Fudosan Co., Ltd. Mitsui Fudosan Co., Ltd. |
Real Estate | 0.57185 | 0.1622 | 0.6226 | 6.61 | 4.48 | 2.78 |
 Avino Silver & Gold Mines Ltd. Avino Silver & Gold Mines Ltd. |
Materials | 0.51905 | 0.6062 | 1.45 | 117.95 | 29.26 | 0 |
 TDK Corporation TDK Corporation |
Technology | 0.5089 | 1.65 | 1.34 | 22.63 | 8.04 | 4.7 |
 Daiwa House Industry Co.,Ltd. Daiwa House Industry Co.,Ltd. |
Real Estate | 0.5049 | 1.17 | 0.5682 | 9.9 | 7.67 | 4.77 |
 Genpact Limited Genpact Limited |
Technology | 0.47417 | 2.85 | 1.43 | 10.14 | 11.61 | 1.62 |
| DENSO Corporation | Consumer Cyclical | 0.45776 | 1.51 | 1.21 | 27.72 | 10.32 | 3.43 |
| Aeon Co., Ltd. | Consumer Cyclical | 0.44777 | 1.43 | 0.3134 | 67 | 9.88 | 1.04 |
 Bridgestone Corporation Bridgestone Corporation |
Consumer Cyclical | 0.43683 | 0.0787 | 0.9534 | 12.41 | 5.42 | 0 |
 Renesas Electronics Corporation Renesas Electronics Corporation |
Technology | 0.41329 | 2.3 | 3.14 | 13.69 | 8.75 | 2.74 |
 Sompo Holdings, Inc. Sompo Holdings, Inc. |
Financials | 0.40565 | 1.09 | 0.6751 | 7.49 | 4.37 | 4.81 |
 James Hardie Industries plc James Hardie Industries plc |
Materials | 0.40304 | 9.45 | 4.46 | 34.45 | 18.86 | 0 |
| Komatsu Ltd. | Industrials | 0.39133 | 1.31 | 1.09 | 10.66 | 6.43 | 5.81 |
 Clear Channel Outdoor Holdings, Inc. Clear Channel Outdoor Holdings, Inc. |
Consumer Discretionary | 0.38931 | -0.1881 | 0.4548 | 0 | -21.06 | 0 |
 Nippon Yusen Kabushiki Kaisha Nippon Yusen Kabushiki Kaisha |
Industrials | 0.3859 | 0.7584 | 0.8557 | 8.94 | 5.87 | 6.37 |
 Dassault Systèmes SE Dassault Systèmes SE |
Technology | 0.38138 | 4.72 | 6.9 | 35.73 | 21.57 | 0.6435 |
| Sekisui House, Ltd. | Consumer Cyclical | 0.3798 | 1.21 | 0.6992 | 10.74 | 7.9 | 5.34 |
 Japan Exchange Group, Inc. Japan Exchange Group, Inc. |
0.35927 | 0 | 0 | 0 | 768 | 2.63 | |
| Suzuki Motor Corporation | Consumer Cyclical | 0.3503 | 1.04 | 0.6098 | 12.24 | 4.69 | 2.73 |
 Kawasaki Kisen Kaisha, Ltd. Kawasaki Kisen Kaisha, Ltd. |
Industrials | 0.34368 | 0.3099 | 0.5231 | 4.8 | 2.76 | 7.57 |
 Toyota Tsusho Corporation Toyota Tsusho Corporation |
Industrials | 0.33037 | 1.4 | 0.3599 | 11.06 | 7.32 | 4.66 |
 SECOM CO., LTD. SECOM CO., LTD. |
Industrials | 0.31606 | 0.8463 | 1.02 | 11.54 | 2.82 | 5.32 |
 Mitsui O.S.K. Lines, Ltd. Mitsui O.S.K. Lines, Ltd. |
Industrials | 0.30947 | 0.722 | 1.05 | 6.54 | 6.92 | 9.32 |
 InterContinental Hotels Group PLC InterContinental Hotels Group PLC |
Real Estate | 0.30914 | -8.9 | 4.17 | 32.73 | 18.66 | 1.46 |
| Strong Global Entertainment, Inc. | Technology | 0.309 | 1.42 | 0.9371 | 3.76 | 24.15 | 0 |
 Ajinomoto Co., Inc. Ajinomoto Co., Inc. |
Consumer Staples | 0.29935 | 3.23 | 1.98 | 32.76 | 13.97 | 2.02 |
 Nomura Holdings, Inc. Nomura Holdings, Inc. |
Financials | 0.29841 | 0 | 0 | 0 | -9.92 | 4.88 |
| Nippon Steel Corporation | Materials | 0.29773 | 0.7348 | 0.4438 | 7.16 | 6.08 | 0 |
 Nomura Research Institute, Ltd. Nomura Research Institute, Ltd. |
Technology | 0.29143 | 6.06 | 3.32 | 30.66 | 14.99 | 1.68 |
 The Kansai Electric Power Company, Incorporated The Kansai Electric Power Company, Incorporated |
Utilities | 0.28734 | 0.8167 | 0.4694 | 4.31 | 5.32 | 3.44 |
| Boltek Holdings Limited | Industrials | 0.28516 | 1.46 | 1.31 | 7.94 | 4.62 | 49.11 |
 Toppan Inc. Toppan Inc. |
Industrials | 0.27804 | 0.7586 | 0.7085 | 15.98 | 4.16 | 1.78 |
| Sumitomo Realty & Development Co., Ltd. | Real Estate | 0.27316 | 0 | 0 | 1.1E-5 | 0.191 | 1.76 |
 Kyocera Corporation Kyocera Corporation |
Technology | 0.26726 | 0.9021 | 1.46 | 29.03 | 11.26 | 4.09 |
 ACADIA ACADIA |
Healthcare | 0.25841 | 1.75 | 1.76 | 25.58 | 13.37 | 0.2201 |
 Toyota Industries Corporation Toyota Industries Corporation |
Consumer Cyclical | 0.25206 | 0.8035 | 1.29 | 21.61 | 10.05 | 2.88 |
| Man Shing Global Holdings Limited | Industrials | 0.2497 | 0.2846 | 0.0386 | 2.46 | 0.81 | 0 |
| Joy Spreader Group Inc. | Communication Services | 0.24876 | 0.3476 | 0.1078 | 11.37 | -3.6 | 0 |
 HeidelbergCement AG HeidelbergCement AG |
Industrials | 0.24856 | 8.06 | 9.14 | 60.2 | 30.66 | 0.12 |
| Sumitomo Forestry Co., Ltd. | Consumer Cyclical | 0.23065 | 0.993 | 0.5351 | 9.05 | 6.82 | 3.85 |
 JAPAN POST BANK Co.,Ltd. JAPAN POST BANK Co.,Ltd. |
Financials | 0.2271 | 0.6297 | 3.78 | 17.16 | -96.16 | 6.38 |
 Stantec Inc. Stantec Inc. |
Industrials | 0.21674 | 4.21 | 1.35 | 26.47 | 12.05 | 0.7457 |
 SCREEN Holdings Co., Ltd. SCREEN Holdings Co., Ltd. |
Technology | 0.21369 | 4.88 | 3.6 | 25.73 | 15.74 | 2.75 |
 Shandong Chenming Paper Holdings Limited Shandong Chenming Paper Holdings Limited |
Materials | 0.21136 | 0.2549 | 0.2222 | 34.02 | 7.16 | 0 |
 Avis Budget Group, Inc. Avis Budget Group, Inc. |
Industrials | 0.2037 | -20.62 | 0.5889 | 4.33 | 5.68 | 0 |
 Osaka Gas Co., Ltd. Osaka Gas Co., Ltd. |
Utilities | 0.20099 | 0.888 | 0.6842 | 10.74 | 6.59 | 3.7 |
| Nippon Sanso Holdings Corporation | 0.19608 | 2.2 | 1.66 | 19.66 | 10.01 | 1.35 | |
 CyberArk Software Ltd. CyberArk Software Ltd. |
Technology | 0.19155 | 11.44 | 12.06 | 2320 | -95.8 | 0 |
 Mitsubishi HC Capital Inc. Mitsubishi HC Capital Inc. |
0.19017 | 0 | 0 | 0 | -0.2433 | 5.47 | |
| Hulic Co., Ltd. | Real Estate | 0.17161 | 1.46 | 2.52 | 11.91 | 15.31 | 5.55 |
 Konami Group Corporation Konami Group Corporation |
Communication Services | 0.16951 | 3.25 | 3.85 | 23.46 | 11.04 | 0 |
 United States Steel United States Steel |
Materials | 0.16158 | 1.1 | 0.7638 | 13.69 | 6.7 | 0.5092 |
 Subaru Corporation Subaru Corporation |
Consumer Cyclical | 0.16126 | 1.01 | 0.5516 | 6.74 | 2.74 | 2.21 |
| Kobe Steel, Ltd. | 0.15453 | 0.7592 | 0.3365 | 7.81 | 4.98 | 6.84 | |
 Dai Nippon Printing Co., Ltd. Dai Nippon Printing Co., Ltd. |
Industrials | 0.1506 | 0.9316 | 0.8086 | 10.39 | 5.49 | 3.28 |
 Obayashi Corporation Obayashi Corporation |
Industrials | 0.1467 | 1.14 | 0.5836 | 18.08 | 9.75 | 5.85 |
| Sanwa Holdings Corporation | Industrials | 0.14501 | 2.05 | 0.9595 | 13.56 | 6.88 | 3.6 |
 Chubu Electric Power Company, Incorporated Chubu Electric Power Company, Incorporated |
Utilities | 0.14383 | 0.5617 | 0.4193 | 3.75 | 5.52 | 4.59 |
| SouthGobi Resources Ltd. | Energy | 0.13951 | -0.682 | 0.2908 | 106.15 | 29.48 | 0 |
| CNA Financial Corporation | Financials | 0.13885 | 1.16 | 0.8717 | 9.49 | -224.23 | 3.55 |
 Keisei Electric Railway Co., Ltd. Keisei Electric Railway Co., Ltd. |
Industrials | 0.13532 | 0.755 | 1.19 | 4.04 | 4.03 | 2.22 |
 Zensho Holdings Co., Ltd. Zensho Holdings Co., Ltd. |
Consumer Cyclical | 0.13483 | 4.52 | 1.01 | 31.64 | 14.04 | 0.9902 |
| Fuji Electric Co., Ltd. | Industrials | 0.13435 | 2.13 | 1.28 | 18.69 | 8.95 | 2.2 |
| Trend Micro Incorporated | Technology | 0.13132 | 5.2 | 4.48 | 103.91 | 14.01 | 10.11 |
 Ebara Corporation Ebara Corporation |
Industrials | 0.13054 | 2.34 | 1.31 | 15.93 | 8.73 | 2.85 |
 Yamaha Motor Co., Ltd. Yamaha Motor Co., Ltd. |
Consumer Cyclical | 0.12681 | 1.1 | 0.5407 | 7.96 | 5.8 | 5.11 |
 Nissin Foods Holdings Co.,Ltd. Nissin Foods Holdings Co.,Ltd. |
0.11852 | 2.45 | 1.79 | 24.2 | 11.49 | 2.35 | |
| Niterra Co., Ltd. | Consumer Cyclical | 0.11757 | 1.62 | 1.68 | 12.48 | 6.51 | 5.62 |
 Otsuka Corporation Otsuka Corporation |
Technology | 0.11519 | 3.27 | 1.16 | 23.94 | 12.9 | 2.01 |
 JFE Holdings, Inc. JFE Holdings, Inc. |
0.11111 | 0.6449 | 0.3164 | 8.29 | 5.7 | 6.51 | |
| Toyo Suisan Kaisha, Ltd. | 0.10977 | 2.09 | 2.03 | 17.84 | 8.91 | 2.32 | |
 Seibu Holdings Inc. Seibu Holdings Inc. |
Industrials | 0.10839 | 1.67 | 1.51 | 26.74 | 14.21 | 1.49 |
 Aisin Corporation Aisin Corporation |
Consumer Cyclical | 0.10582 | 0.229 | 0.1121 | 6.06 | 1.86 | 11.93 |
| Future Bright Mining Holdings Limited | Materials | 0.10577 | 6.04 | 2.58 | 0 | -41.56 | 0 |
| Hikari Tsushin, Inc. | Industrials | 0.09656 | 1.51 | 2.05 | 10.09 | 9.05 | 2.41 |
 Mi Ming Mart Holdings Limited Mi Ming Mart Holdings Limited |
Consumer Cyclical | 0.09462 | 1.03 | 0.9783 | 9.76 | 2.99 | 15.66 |
| Nextracker Inc. | Technology | 0.09419 | 8.41 | 3.34 | 27.26 | 13.55 | 0 |
 Mitsui Chemicals, Inc. Mitsui Chemicals, Inc. |
0.09352 | 0.8587 | 0.4833 | 16.91 | 7.69 | 5.22 | |
 Kuraray Co., Ltd. Kuraray Co., Ltd. |
0.09159 | 0.6598 | 0.622 | 11.44 | 4.4 | 3.79 | |
 Skylark Holdings Co., Ltd. Skylark Holdings Co., Ltd. |
Consumer Cyclical | 0.08982 | 3.21 | 1.39 | 39.91 | 8.87 | 0.8656 |
 Kyushu Electric Power Company, Incorporated Kyushu Electric Power Company, Incorporated |
Utilities | 0.08818 | 0.7095 | 0.3054 | 3.93 | 7.17 | 2.51 |
| Santen Pharmaceutical Co., Ltd. | Healthcare | 0.08596 | 1.79 | 1.81 | 20.49 | 8.61 | 3.14 |
 Ryohin Keikaku Co., Ltd. Ryohin Keikaku Co., Ltd. |
Consumer Cyclical | 0.0858 | 2.27 | 1.04 | 27.47 | 9.18 | 1.88 |
 Tokyu Fudosan Holdings Corporation Tokyu Fudosan Holdings Corporation |
Real Estate | 0.08337 | 0.2837 | 0.7594 | 12.22 | 4.96 | 4.29 |
| Cosmo Energy Holdings Co., Ltd. | Energy | 0.08109 | 0.9112 | 0.2426 | 8.07 | 5.41 | 5.04 |
 McDonald's Holdings Company (Japan), Ltd. McDonald's Holdings Company (Japan), Ltd. |
Consumer Cyclical | 0.07457 | 3.59 | 2.13 | 32.34 | 13.24 | 1.47 |
 Nova Measuring Instruments Ltd. Nova Measuring Instruments Ltd. |
Technology | 0.07356 | 5.78 | 8.38 | 31.84 | 31.39 | 0 |
| USS Co., Ltd. | Consumer Cyclical | 0.07305 | 3.07 | 6.26 | 18.57 | 9.36 | 4.27 |
 Sojitz Corporation Sojitz Corporation |
Industrials | 0.0728 | 0.9446 | 0.3738 | 8.96 | 8.97 | 0 |
| Alfresa Holdings Corporation | Healthcare | 0.07279 | 0.9092 | 0.1526 | 14.76 | 4.48 | 1.78 |
| MediPal Holdings Corporation | Healthcare | 0.06978 | 0.6686 | 0.1384 | 11.87 | 4.02 | 3.56 |
| Frontline Ltd. | Energy | 0.06868 | 2.1 | 2.67 | 7.28 | 8.45 | 10.09 |
| Waterdrop Inc. | Financials | 0.06821 | 0.6163 | 1.1 | 17.24 | 1086.64 | 2.74 |
| MGM China Holdings Limited | Consumer Cyclical | 0.06813 | -28.37 | 1.53 | 14.27 | -35.45 | 2.05 |
 The Yokohama Rubber Co., Ltd. The Yokohama Rubber Co., Ltd. |
Consumer Cyclical | 0.06636 | 0.6907 | 0.5249 | 7.69 | 5.6 | 3.99 |
| Beijing Sports and Entertainment Industry Group Limited | Consumer Cyclical | 0.06634 | 0.8032 | 2.44 | 0 | -1.61 | 0 |
 Nichirei Corporation Nichirei Corporation |
0.06522 | 1.97 | 0.7718 | 21.43 | 9.68 | 2.53 | |
| Yamato Kogyo Co., Ltd. | 0.06488 | 1.02 | 3.45 | 8.05 | 3.16 | 5.84 | |
| Tokyo Tatemono Co., Ltd. | Real Estate | 0.0645 | 0.8479 | 1.15 | 9.55 | 15.28 | 4.59 |
 SCSK Corporation SCSK Corporation |
Technology | 0.06097 | 2.97 | 1.87 | 22.25 | 10.31 | 3.1 |
| Amada Co., Ltd. | Industrials | 0.06058 | 1.15 | 1.52 | 15.14 | 6.55 | 5.58 |
| Socionext Inc. | Industrials | 0.05931 | 6.06 | 3.59 | 30.39 | 14.86 | 2.2 |
 Nomura Real Estate Holdings, Inc. Nomura Real Estate Holdings, Inc. |
Real Estate | 0.05895 | 0.3275 | 0.9504 | 10.24 | 6.02 | 5.27 |
| Tokyo Electric Power Company Holdings, Incorporated | Utilities | 0.05679 | 1.21 | 0.619 | 15.99 | 13.21 | 0 |
 Tobu Railway Co., Ltd. Tobu Railway Co., Ltd. |
Industrials | 0.05444 | 1.52 | 1.29 | 17.06 | 12.13 | 2.4 |
| Enterprise Development Holdings Limited | Technology | 0.05243 | 0.9528 | 4.15 | 45.35 | -6.18 | 0 |
| FSM Holdings Limited | Industrials | 0.0426 | 2.39 | 5.06 | 140.71 | 44.67 | 0 |
| Toyo Seikan Group Holdings, Ltd. | Consumer Cyclical | 0.04203 | 0.6423 | 0.471 | 19.4 | 6.13 | 5.74 |
| Tokyo Century Corporation | Industrials | 0.04172 | 0 | 0 | 0 | 0.1796 | 4.75 |
 Canon Marketing Japan Inc. Canon Marketing Japan Inc. |
Industrials | 0.04006 | 1.24 | 0.8854 | 14.79 | 7.2 | 3.94 |
| Yum China Holdings, Inc. | Consumer Cyclical | 0.0398 | 2.34 | 1.52 | 20.14 | 111.21 | 1.85 |
 Kamigumi Co., Ltd. Kamigumi Co., Ltd. |
Industrials | 0.03807 | 0.9459 | 1.37 | 14.63 | 6.46 | 4.54 |
| Meilleure Health International Industry Group Limited | Industrials | 0.03743 | 0.7602 | 7.37 | 23.35 | 30.49 | 11.56 |
 Camtek Ltd. Camtek Ltd. |
Technology | 0.03657 | 6.92 | 10.62 | 42.59 | 35.97 | 0 |
| Hitachi Construction Machinery Co., Ltd. | Industrials | 0.03622 | 1.19 | 0.6887 | 10.38 | 6 | 5.31 |
| Shinko Electric Industries Co., Ltd. | Technology | 0.03593 | 2.89 | 3.64 | 41.12 | 13.58 | 1.34 |
 TBS Holdings,Inc. TBS Holdings,Inc. |
Communication Services | 0.02963 | 0.5952 | 1.74 | 17.95 | 8.63 | 1.66 |
 JTEKT Corporation JTEKT Corporation |
Consumer Cyclical | 0.02805 | 0.5905 | 0.2569 | 12.07 | 3.79 | 4.47 |
 Toei Animation Co.,Ltd. Toei Animation Co.,Ltd. |
Communication Services | 0.02496 | 0.9643 | 1.43 | 6.76 | 1.99 | 2.09 |
| Cellebrite DI Ltd. | Technology | 0.01105 | 48.63 | 5.12 | 5.36 | 34.38 | 0 |
| 77.19 | 2.24 | 2.19 | 34.81 | 16.56 | 3.45 |
Invesco S&P International Developed Momentum ETF
六个月盈利: 6.75%
行业: Large Cap Growth Equities
支付您的订阅费用
通过订阅可获得更多用于公司和投资组合分析的功能和数据